

Association and Visualization of Clusters Using Multi-Algorithms Voting
Abstract
Currently, supervised as well as unsupervised cluster analysis are limited in their ability to support “Cross-Algorithms” analysis. It is well known that each cluster analysis algorithm yields different results; even running the same algorithm with two different similarity measures commonly yields different results. Researchers usually choose the preferred algorithm and similarity measure according to analysis objectives and datasets features, but they have neither a formal method nor tool, which supports comparisons and evaluations of the different classifications that result from the diverse algorithms.
Current research development and prototype a methodology based upon formal-quantitative measures and a visual approach, enabling presentation, comparison and evaluation of multiple clustering suggestions, resulting from diverse algorithms.
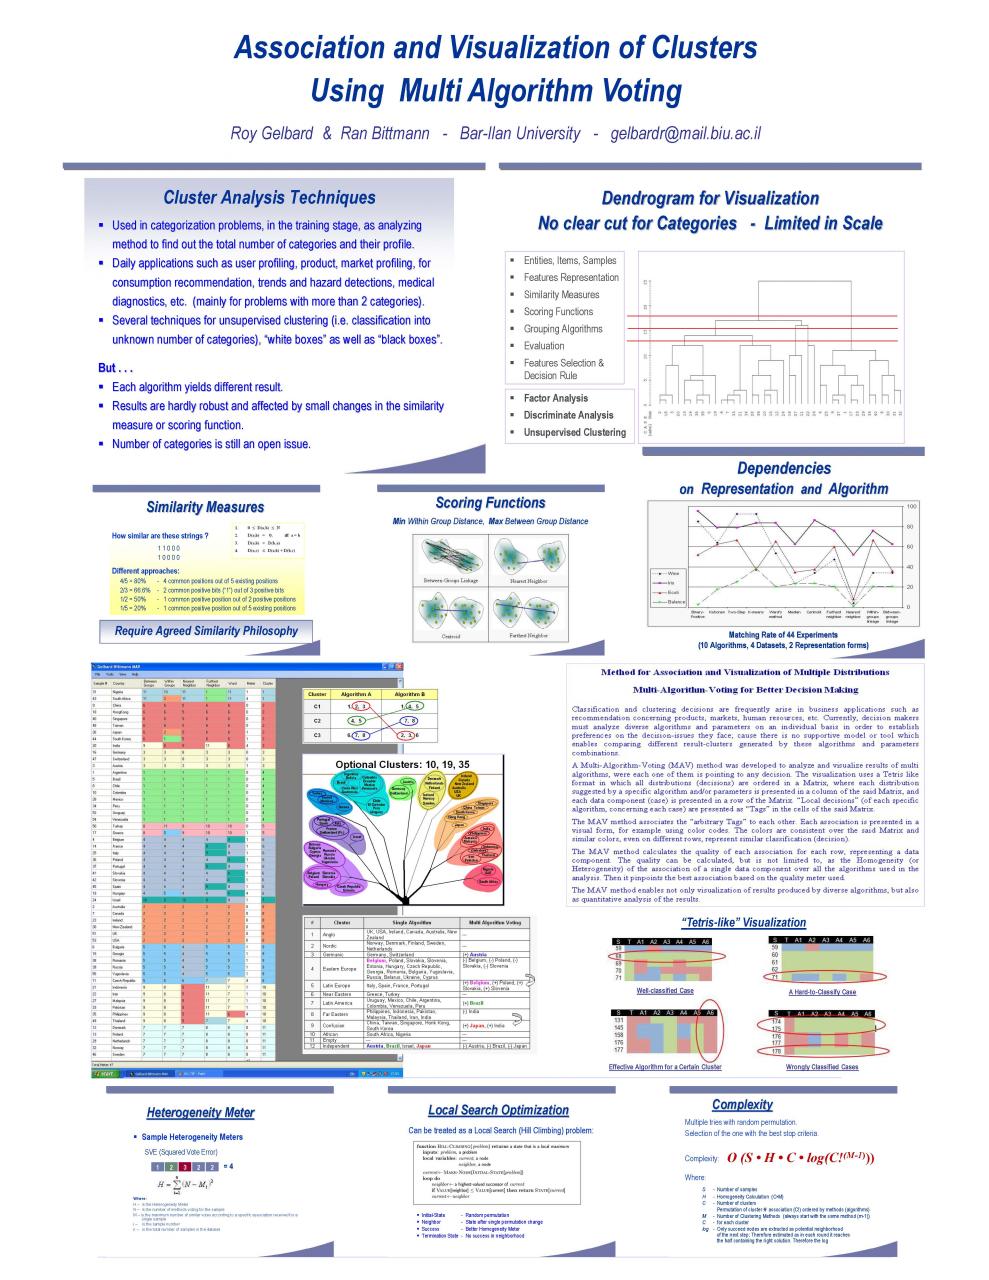
The suggested methodology and DSS produced a cross-algorithms presentation; all resultant classifications are presented together in a “Tetris-like format”. Each column represents a specific classification algorithm, each line represents a specific sample, and formal-quantitative measures analyze those “Tetris blocks”, arranging them according to their best structures, i.e. best classification